
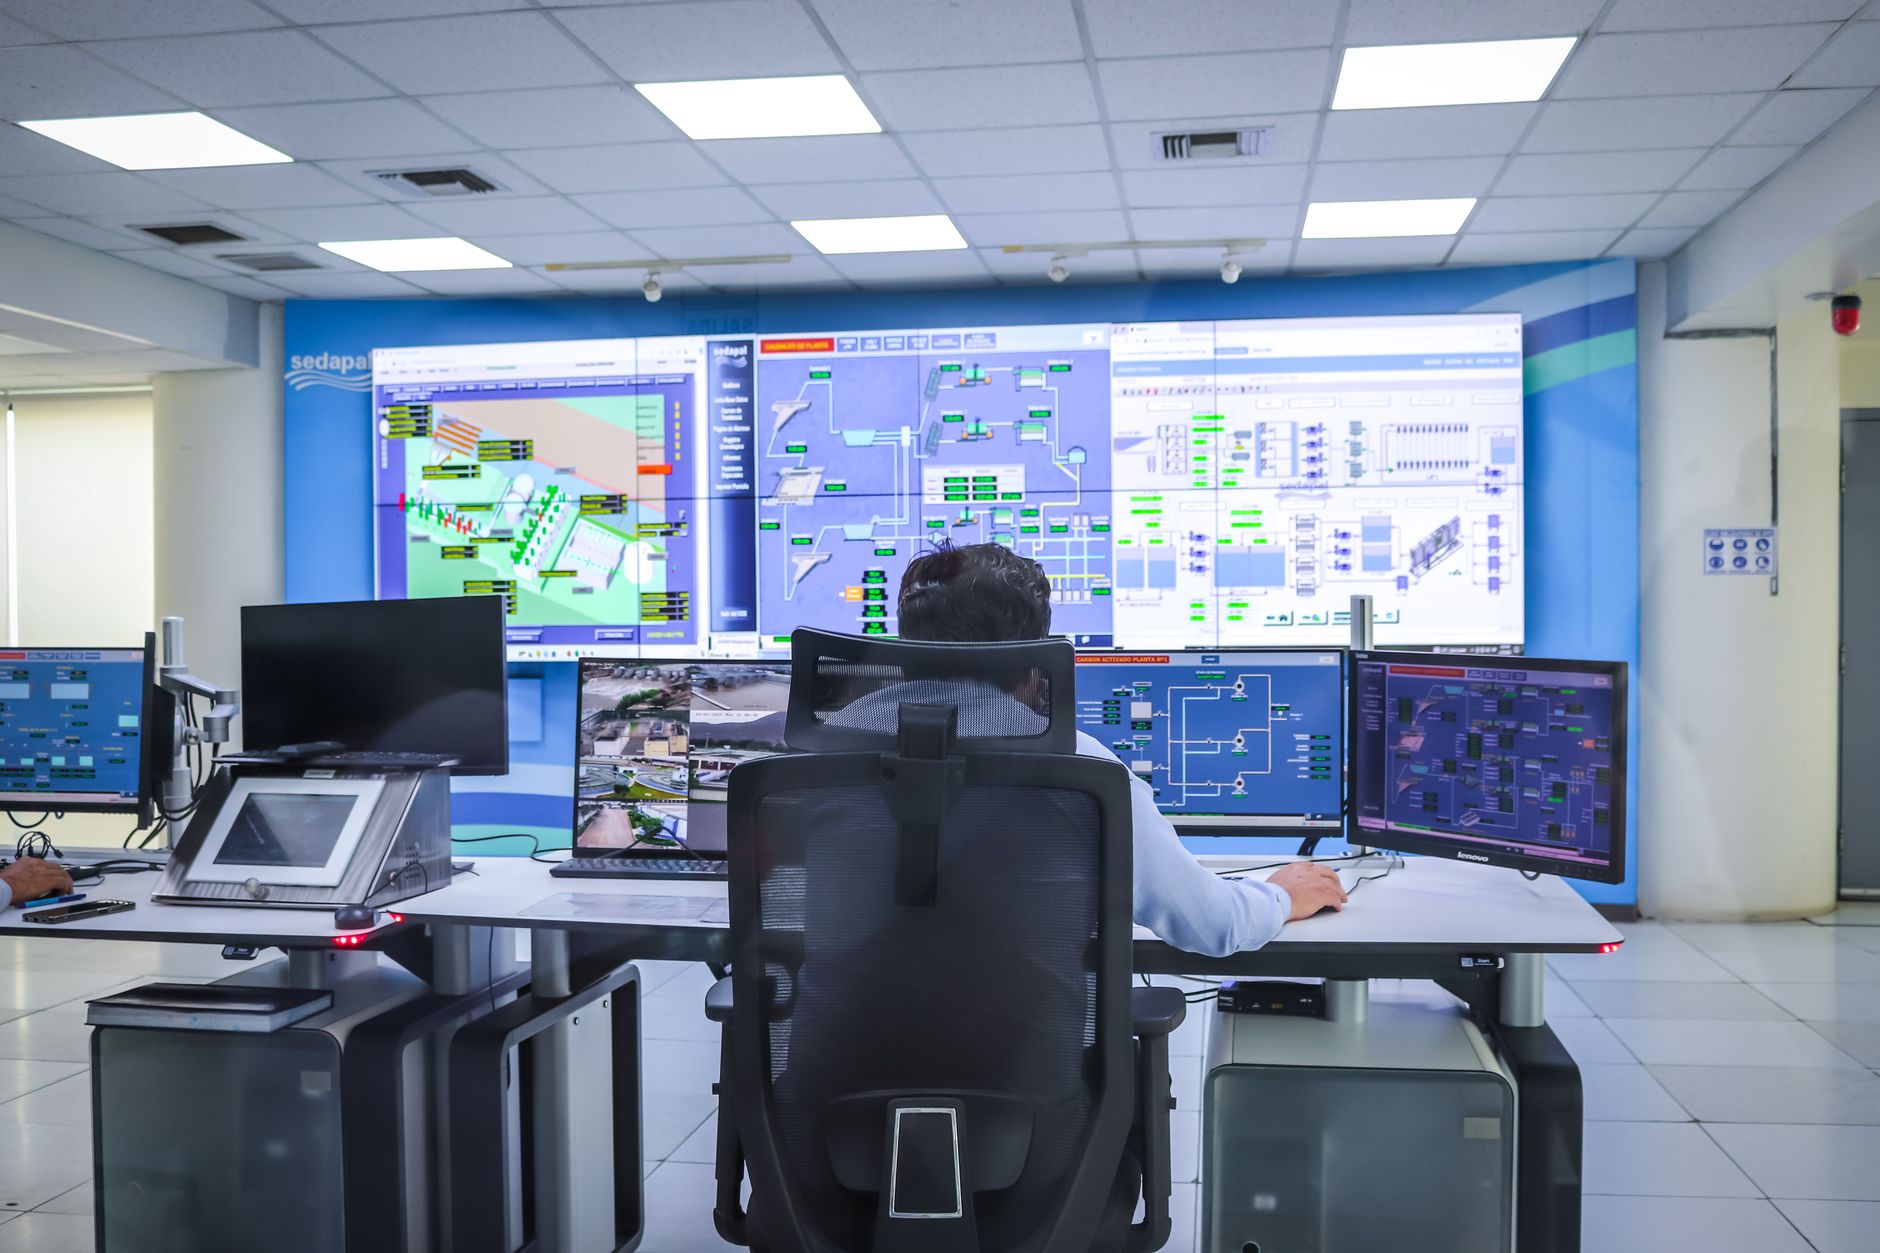
Every MES rollout has a moment, usually four to eight weeks after go-live, when someone on the production floor says the dashboard is wrong. The OEE number doesn’t match what the line actually did. A downtime event that everyone remembers isn’t in the system, or it’s there twice. By that point the operators have stopped trusting the screens, the plant manager is asking the project team pointed questions, and you’re debugging in production with an audience. Almost none of this is inevitable. It’s the direct result of validation work that got skipped during commissioning because the OPC UA connection “looked fine” in a quick browse test.
Browsing tags in an OPC UA client and confirming values update is not validation. It tells you the server is alive. It tells you nothing about whether your subscription configuration will hold up under real production load, whether timestamps are trustworthy, or whether quality codes are being handled the way your MES assumes they are. Those three things — subscription behavior, timestamp source, and quality-code handling — are where silent data-quality failures live, and they’re exactly the things a five-minute smoke test won’t catch.
Why this fails quietly instead of loudly
OPC UA is a mature, well-behaved standard. Servers rarely crash outright, and connections rarely drop in ways that trigger obvious alarms. What actually happens is subtler: a tag is sampled faster than it needs to be and floods the subscription; a deadband is set too wide and masks real state changes; a PLC’s local clock drifts from the OPC UA server’s clock and timestamps stop lining up with reality. None of that throws an error. It just quietly corrupts the data feeding your KPI calculations, and it keeps doing so until someone notices the numbers don’t add up — usually a month or two in, once enough bad data has accumulated to be visible in a trend.
The core validation protocol
1. Load-test the subscription, not just the connection
Before cutover, build your full production tag set — every tag the MES will actually subscribe to, at the real sampling and publishing intervals — and run it against the OPC UA server for a sustained period, not a five-minute demo. Watch for:
- Subscription storms: tags configured with sampling intervals far faster than the underlying process changes (a discrete state tag polled every 100 ms when it changes twice a shift). These inflate notification volume for no benefit and can overwhelm the server’s queue or your MES connector’s ingestion rate.
- Queue overflow behavior: confirm what the server does when the notification queue fills — does it discard oldest or newest values, and does your MES care? This matters enormously for fast-changing analog tags feeding calculations like cycle time.
- Publishing interval vs. sampling interval mismatch: OPC UA lets you sample fast and publish slow, which quietly collapses multiple changes into one reported value. If your downtime logic needs every transition, this setting alone can eat events.
Run this test at the tag-set scale you’ll actually deploy, across every server/gateway in the architecture, not just one. A single line’s tag set behaving fine tells you very little about what happens when the whole plant’s tags hit the server simultaneously at shift start.
2. Interrogate deadband settings tag by tag
Deadband suppresses reporting of small value changes, which is good for reducing noise on analog signals like temperature or pressure, and terrible when applied carelessly to tags that drive state logic. A common failure mode: someone applies a blanket deadband setting across a tag group during commissioning to cut network traffic, and it happens to include a counter or status tag whose small increments are exactly what the MES needs to detect a state change. Go through every tag that feeds downtime, OEE, or counting logic and confirm deadband is either disabled or set intentionally — not inherited from a template.
3. Pin down the timestamp source
OPC UA gives you (at minimum) a source timestamp and a server timestamp, and MES ingestion pipelines vary in which one they trust by default. Verify explicitly:
- Which timestamp your MES connector actually ingests and stores.
- Whether the source timestamp comes from the PLC or device clock, and whether that clock is synchronized (NTP or equivalent) to the same time reference as the MES server and historian.
- What happens when source and server timestamps disagree by more than a trivial amount — does your pipeline flag it, or silently accept the source timestamp as truth?
Clock drift between controllers is common and usually harmless for control purposes, but it’s poison for downtime sequencing and OEE math that correlates events across multiple machines or lines. Test this before cutover by comparing timestamps across a sample of PLCs against a common reference, not after someone notices a downtime event that ended before it started.
4. Treat quality codes as first-class data, not metadata
Every OPC UA value carries a quality code — Good, Uncertain, Bad, and various sub-statuses — and it’s astonishing how often MES ingestion logic ignores it entirely, treating any received value as valid. Before go-live, force bad-quality conditions deliberately: pull a network cable, stop a PLC scan, force a sensor fault, and confirm what your MES does with the resulting quality code. Does it hold the last good value, insert a null, or worse, silently accept a stale or garbage value as current? Also check what happens on reconnect after an outage — some systems backfill from buffer, others just resume from “now” and leave a silent gap in the historical record that nobody notices until someone audits a shift.
Build a reconciliation test before you trust the dashboard
The last step, and the one teams skip most often because it’s manual and unglamorous: run a shift or a full day in parallel, comparing MES-reported events against a manually logged shop-floor record — operator logs, paper downtime sheets, whatever the plant used before. Reconcile every discrepancy. Duplicate timestamps, missing events, and phantom state changes almost always show up in this comparison before they show up in a dashboard trend line, and they’re far cheaper to fix now than after operators have decided the system can’t be trusted.
What “done right” looks like
A validated tag set going into cutover means: every tag’s sampling and publishing interval is intentional, not templated; deadband is set per tag type with a documented rationale; timestamp source is known and clocks are synchronized to a common reference; quality-code handling has been tested under actual fault conditions, not assumed; and a manual reconciliation has confirmed the numbers match reality for at least one full production cycle. None of this is exotic engineering — it’s the same discipline you’d apply to commissioning a safety system, applied to the data layer instead. The plants that skip it don’t find out until the dashboards start lying, and by then the cost isn’t technical, it’s the operators’ trust in the system you just spent months building.
This article was written with the assistance of artificial intelligence. While we aim for accuracy, the information may be incomplete, out of date, or incorrect, and should be independently verified before you rely on it for any decision. It is provided for general information only and does not constitute professional advice.