
OEE was built for a world where a line had one asset, one nameplate speed, and one shift pattern that started and stopped for everybody at the same time. That world still exists in plenty of plants. But it doesn’t exist on the growing number of lines where a cobot handles a station around the clock while human operators work standard shifts on either side of it — and when you run the textbook formula against that setup, you get a number that looks precise and means almost nothing.
This isn’t a new metric problem. It’s an old metric being applied to an asset configuration it was never designed to describe. Once you see why it breaks, the fix is mostly bookkeeping — but you have to know where the bookkeeping has to change.
The formula everyone learned, and the assumption baked into it
Standard OEE is Availability × Performance × Quality:
- Availability = Run Time ÷ Planned Production Time
- Performance = (Total Count × Ideal Cycle Time) ÷ Run Time
- Quality = Good Count ÷ Total Count
Every term in that formula quietly assumes a single denominator clock. Planned Production Time assumes one shift calendar. Ideal Cycle Time assumes one rate for the whole line. Run Time assumes the line is either up or down as a unit, not up for the machine and down for the people, or vice versa.
A cobot cell breaks all three assumptions at once. The cobot may run through breaks, lunch, and off-shift hours because it doesn’t need to clock out. The human stations bracketing it do not. So “the line” doesn’t have one Planned Production Time — it has at least two, running on different calendars, and the line’s actual output in any given hour depends on which asset was the constraint during that hour.
Where this actually shows up on the shop floor
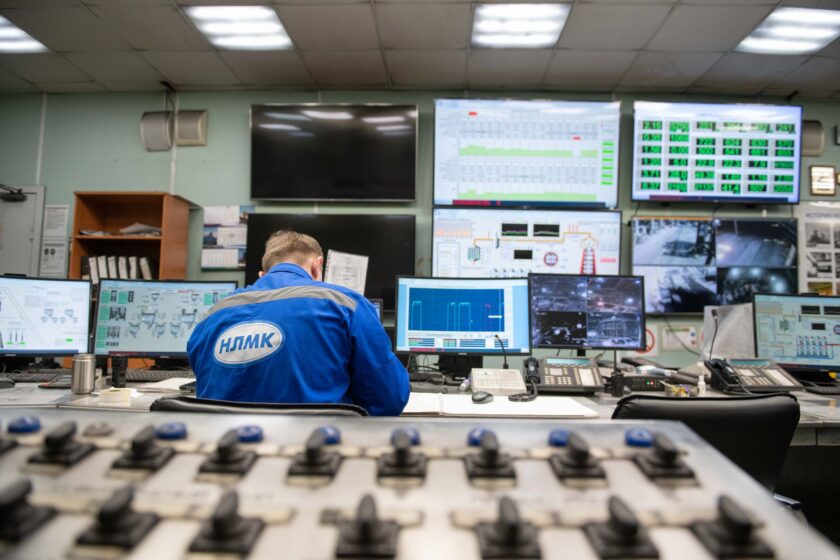
Picture a three-station cell: a human loads fixtures, a cobot performs a bonding or dispensing operation, and a second human inspects and packs. The humans work an eight-hour shift with a half-hour lunch and two paid breaks. The cobot is programmed to keep cycling through all of it, buffering parts upstream and downstream where fixture capacity allows.
If you calculate OEE using the cobot’s run time as your Planned Production Time, you’ll show high Availability — the cobot barely stops. But nothing is coming off the end of the line during lunch, because the human pack station is empty. If you instead calculate using the human shift calendar, you’ll penalize the cobot for “downtime” during the exact hours it was doing exactly what it was told to do: keep working while people ate lunch. Neither number describes the cell. Both are technically defensible and both are wrong for decision-making, which is the worst kind of wrong — it doesn’t fail loudly, it just quietly misleads whoever is looking at the dashboard.
The buffer problem compounds it
Cobot cells usually have some in-process buffer specifically so the cobot can keep working during human breaks. That buffer is doing real work — it’s decoupling two different operating calendars — but it also means the cobot’s local cycle count during unattended time doesn’t translate one-for-one into line throughput. Parts can pile up in a buffer and then get consumed later, which further breaks any calculation that treats “units counted at the cobot” as equivalent to “units the line actually produced.”
The corrected approach: calculate OEE per constraint, then roll up
The fix is to stop treating the cell as one asset and start treating it as what it is: a set of resources with independent availability calendars, feeding a shared throughput number. This is closer to how ISA-95 and line-level OEE rollups are supposed to work anyway — asset-level metrics that aggregate to a line or area metric, rather than one metric standing in for the whole line.
In practice, that means:
- Calculate Availability separately for the cobot and for each human station, each against its own Planned Production Time. The cobot’s planned time might be near-continuous minus scheduled maintenance and changeovers; the human stations’ planned time is the shift calendar minus scheduled breaks.
- Calculate line Performance against the true bottleneck, not against whichever asset is easiest to instrument. If the human pack station is the slowest step, the line’s effective Ideal Cycle Time is the pack station’s, not the cobot’s — running the cobot faster doesn’t move product any faster once the buffer between them fills up.
- Treat unattended cobot output during human off-hours as work-in-process, not as finished line output, until it clears the downstream human station. Otherwise you’ll report a production count that includes parts sitting in a buffer waiting for someone to come back from lunch.
- Roll these up into a line-level OEE that reflects actual shippable output over actual calendar time — not the best-looking asset in the cell.
A worked example
Say the human stations run an 8-hour shift with 45 minutes of combined breaks, so Planned Production Time for the line’s shippable output is 7.25 hours. The cobot, left running, logs cycles across a full 10-hour window including the periods when humans are off. Ideal cycle time at the bottleneck (the human inspect/pack step) is 30 seconds per unit.
If the cobot logs 900 cycles over its 10-hour window, but only 780 of those units actually clear the pack station within the 7.25-hour shift window (the rest sit in buffer or get packed the next shift), then:
- Total Count for the line, this shift, is 780 — not 900.
- Performance = (780 × 30 seconds) ÷ (7.25 hours × 3600 seconds) ≈ 0.90, or 90%.
- Availability is calculated against the pack station’s planned time, separately from the cobot’s own near-continuous uptime figure, which you’d still track — just as a different metric, not folded into the same ratio.
- Quality, as always, is good units ÷ total units actually counted as line output — 780, not 900.
Notice what this does: it keeps the cobot’s raw productivity visible as its own asset-level number, useful for justifying the cobot investment or spotting cobot-specific faults, while keeping the line-level OEE honest about what actually shipped in the shift.
Where to pull the timestamps from — and why it matters
Getting this right depends entirely on sourcing the right clock for the right question, and the three obvious sources don’t agree with each other by design.
- The cobot controller (whether it’s speaking PackML state models or a vendor-specific interface) gives you accurate cycle counts and fault codes for the cobot itself, but it has no idea whether a human is present downstream to receive its output.
- The PLC or line controller typically has the best visibility into physical flow — sensors on buffers, part-present detection, station-to-station handoffs — which is exactly what you need to know whether a cobot’s output actually cleared the line or is sitting in WIP.
- The MES is where shift calendars, planned downtime, and labor schedules live, and it’s the only layer that reliably knows when a human station is staffed versus on break.
None of these three systems alone can produce a correct line-level OEE for a mixed cell. The PackML/MES integration work that’s picked up through 2025 and into 2026 is mostly an attempt to solve exactly this — giving MES a standardized state model (Idle, Running, Held, Suspended, and so on) it can reconcile against both the cobot’s own state and the human shift calendar, rather than treating the cobot as a black box that’s either “up” or “down.”
If your MES is pulling cycle counts straight from the cobot controller and Planned Production Time straight from the labor schedule, without reconciling the two through PLC-level flow data, you will get an OEE number every time — the math will run, the dashboard will populate — and it will not describe your line. The number will look confident. That’s the trap. A wrong OEE that looks precise is more dangerous than an OEE you know is rough, because people will make staffing and investment decisions off it.
What to actually do about it
Start by mapping which asset is the true bottleneck at each hour of the shift, not just at nominal rate — cobots and humans can trade off which one is constraining output depending on time of day. Instrument the buffer between cobot and human stations if you don’t already, since that’s the physical evidence of decoupled calendars. Report cobot-level and line-level OEE as two related but distinct numbers, and make sure whoever reads the dashboard knows which one they’re looking at. And when you’re evaluating MES or cobot integration tooling, ask specifically how it reconciles PLC-level flow data with cobot controller state and MES shift calendars — if the answer is “we take the cobot’s cycle count as the line’s output,” you already know where the number will go wrong.
This article was written with the assistance of artificial intelligence. While we aim for accuracy, the information may be incomplete, out of date, or incorrect, and should be independently verified before you rely on it for any decision. It is provided for general information only and does not constitute professional advice.