Every plant manager who’s spent the last decade building out a clean OEE data model is about to get a memo from finance or legal asking for machine-level energy and emissions data, tied to specific production runs, auditable enough to survive a limited-assurance review. If your CSRD or ISSB-aligned reporting obligations land in your 2026 fiscal filing, that memo has probably already arrived. The instinct in a lot of plants is to treat this as a new problem requiring a new system. It isn’t, and it doesn’t.
The mistake I’d steer you away from is standing up a separate sustainability data platform that pulls its own feed from utility meters, gets reconciled by someone in EHS once a quarter, and never quite matches what ERP reports to the board. That’s not a reporting system, that’s a second shadow historian, and you already have one of those you don’t like (the spreadsheet macros bridging your MES and your ERP). Energy and carbon intensity per unit of good output is fundamentally a production loss metric. It belongs in the same data model where you already track downtime, scrap, and cycle time deviation — because the causes are the same causes.
Why this is an OEE problem wearing a compliance costume
Think about what actually drives energy-per-unit-good-output on a line. A machine idling between changeovers still pulls a compressor load or a heater bank at near-full draw. A run producing scrap consumes the same energy as a run producing acceptable parts, but the denominator — good units — collapses, so intensity spikes. A line running below rate to work around a bottleneck upstream often runs less efficiently per unit than one running at designed throughput. Every one of these is a loss category your OEE model already has a bucket for: availability loss, quality loss, performance loss. Energy intensity isn’t a new axis of measurement. It’s a new numerator layered onto loss categories you’re already computing.
This matters because it means you don’t need a new conceptual framework to comply. You need to extend the one you have so that kWh (and, where relevant, fuel, compressed air, and steam) get attributed against the same run, downtime, and scrap events already flowing through your MES or historian. If your data model can already answer “how many good units did Line 3 make between 6 a.m. and 2 p.m., and what caused the gaps,” it can answer “how much energy per good unit did Line 3 consume,” with the right metering in the right place.
Where to actually put the meters
This is where most plants either overspend or underdeliver. You don’t need a submeter on every motor. You need meters at the boundary of each ISA-95 work-center or line segment that corresponds to how you already segment OEE — because that’s the granularity your reporting obligation actually asks for, and it’s the granularity your loss analysis already uses.
- Line or cell level, not machine level, as your default. Put a metering point (electrical submeter, or a calibrated VFD/PLC-derived kWh tag if the drive already reports it) at the point where a line draws from the plant’s distribution panel. This gets you energy against a production line that already has a defined OEE calculation.
- Isolate the big non-linear loads separately. Ovens, chillers, compressors, and anything with high idle draw relative to running draw should get their own tag, because lumping them into a line total will make your energy-per-unit number swing wildly with utilization rather than with actual efficiency — and that’s exactly the kind of noise that makes auditors, and your own team, distrust the number.
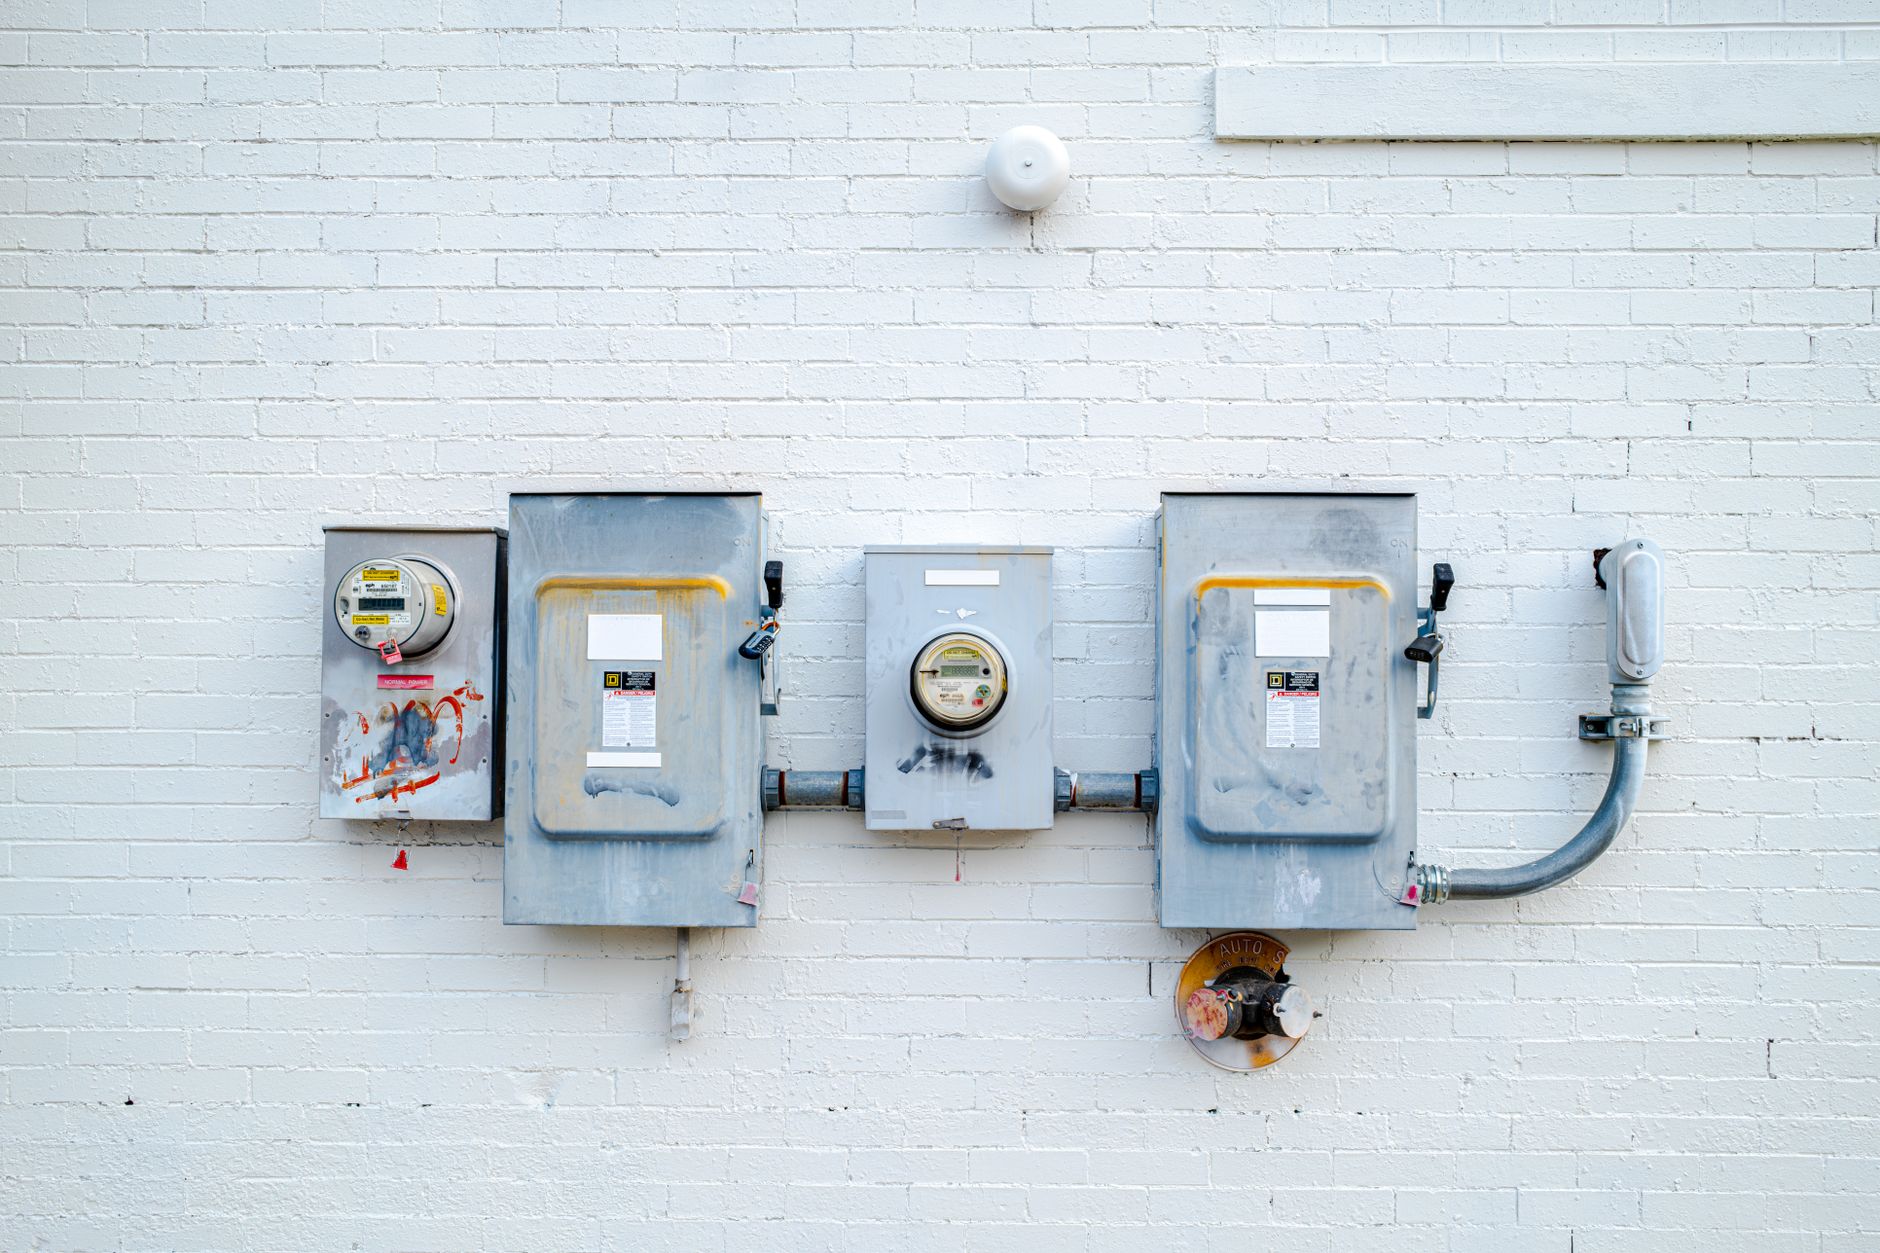
- Use utility-grade meters at the site boundary as your reconciliation anchor, not your primary data source. The site-level utility meter is ground truth for the ERP/finance-reported total. Your line-level submeters will never sum exactly to it — line losses, shared HVAC, lighting, and compressed air headers all eat the difference. That gap is fine and expected; what’s not fine is not being able to explain the size of it.
Folding kWh into loss buckets without inventing new ones
The practical move is to treat energy the way you already treat scrap cost: as a value that rides alongside an existing downtime or quality event record, not as an independent time-series that someone reconciles later. Concretely:
- When a downtime reason code opens (changeover, unplanned stop, starved/blocked), timestamp the cumulative energy meter reading at open and close, same as you’d timestamp a counter. Now you have kWh-per-downtime-event, and you can rank your worst offenders by energy waste the same way you already rank them by minutes lost.
- When a scrap or reject event posts, attribute a share of the run’s energy draw across the bad units, not just the good ones — this is the number that actually changes behavior, because it turns “we scrapped forty parts” into “we scrapped forty parts and burned the equivalent of an extra hour of full-line operation doing it.”
- Report energy-per-good-unit at the same rollup levels — shift, line, plant — where you already report OEE, so the two numbers sit next to each other in the same review cadence instead of arriving from different departments on different schedules.
The reconciliation trap
The single biggest risk in this whole exercise is producing a plant-floor energy number that doesn’t tie back to what ERP and your utility bills report to the sustainability disclosure. Auditors under CSRD’s assurance requirements, and any ISSB-aligned filing, will ask how the two numbers relate. If MES-reported line energy and ERP/utility-reported site energy live in disconnected systems with no defined reconciliation logic, you’ll spend every reporting cycle explaining variances instead of improving them.
The fix isn’t complicated, but it has to be designed in from day one: define the site-level meter as the control total, define your line-level submeters as an allocation of that total, and build the gap (shared services, transmission losses, unmetered loads) into a documented, semi-static offset rather than treating it as unexplained noise. That’s a one-time modeling exercise, not a recurring reconciliation headache, if you set it up as part of the tag structure rather than as a spreadsheet fix after the fact.
Don’t buy a platform to solve a data-modeling problem
There’s a real market now of bolt-on carbon and ESG reporting tools that promise to ingest your production data and spit out a disclosure-ready report. Some of them are genuinely useful for the disclosure formatting and audit trail layer — CSRD’s taxonomy and ISSB’s disclosure structure are their own specialized problem, and you probably don’t want to build that reporting layer yourself. But that’s a presentation and compliance-mapping problem, not a data-capture problem. If you let a sustainability platform become the system of record for what happened on the floor, you’ve built a second historian that has to be manually kept in sync with the one your controls and MES team actually trust, and in three years nobody will be sure which number is right.
The better sequencing is: instrument and model energy inside the data structures you already have for production and loss tracking, get one clean, reconciled feed of energy-per-good-unit at line and site level, and then let a compliance or disclosure tool consume that feed for formatting and audit trail purposes. Your controls engineers and MES admins already know how to keep a tag structure honest. Let them do that job once, instead of twice.
This article was written with the assistance of artificial intelligence. While we aim for accuracy, the information may be incomplete, out of date, or incorrect, and should be independently verified before you rely on it for any decision. It is provided for general information only and does not constitute professional advice.